Ficheiro:Angular map of fusors around Sol within 12ly (large).png

Imagem numa resolução maior (855 × 870 píxeis, tamanho: 85 kB, tipo MIME: image/png)
|
|
Esta imagem provém do Wikimedia Commons, um acervo de conteúdo livre da Wikimedia Foundation que pode ser utilizado por outros projetos.
|
Descrição do ficheiro
| DescriçãoAngular map of fusors around Sol within 12ly (large).png |
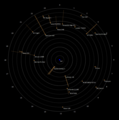
English: This is a stellar map, employing an original map concept, which combines graphically the distance of all stellar systems or singular fusors (stars and brown dwarfs) and sub-brown dwarfs within 12 light-years (ly) or 3.7 parsecs from Earth, along with their angular location as viewed from Earth. The result provides a readable and correct depiction of the distance from the center (Earth/Sol) and location in three dimensional space of the described stellar objects, allowing a correct depiction of proximity among the depicted stellar objects.
How to read: This map is a common radar screen type of map displaying stellar objects around Sol. Each stellar object is marked jointly by two points, a diamond marked point and an line marked point, as well as an either unbroken or dotted straight line which connects the two points.
The circular lines indicate the distance from the map-center by being set apart in one light-year steps. At the outermost circular line the hours angle for the right ascension is displayed clockwise. The circular lines therefore represent the hour-axis and, through their repetition in one light-year steps, the distance-axis.
Straight lines: The straight lines (unbroken or dotted) represent the arcs of the declination angles (see also circular sector of a unit circle) of the stellar objects on their hour circle toward the celestial poles (with the poles being congruent with the center of the map). Since the map is viewed top-down from the south, allowing a clockwise eastward-reading (opposed to when using sidereal hour angles), the dotted straight lines are arcs with positive declination, down from the reference plane/level, toward the star Polaris, the northern celestial pole (which would be allmost congruent with the center of the map, if it would display stars further than 12 ly). That said the straight lines also represent a top-down view of the hypotenuse between the points of a right-angled triangle with its right-angle on the plane/level; but the straight lines, when viewed true to length, represent the base x-line of the described triangle. Calculation of the length of the displayed straight lines is: x = "distance of the stellar objects to the map-center in ly" - ("distance of the stellar objects to the map-center in ly" * sin(180°-90°-"declination"))  Note: Proxima Centauri is the only marked stellar object not labled and not being an independent stellar object or the primary body of a stellar system (which in its case is Alpha Centauri), but still being noteworthy since it is the closest fusor to Sol. Epoch J2000.0, see List of nearest stars and brown dwarfs. Produced with Microsoft Excel (radar chart) |
| Data | |
| Origem | Obra do próprio |
| Autor | Nsae Comp |
| Outras versões |
|
Licenciamento
- Pode:
- partilhar – copiar, distribuir e transmitir a obra
- recombinar – criar obras derivadas
- De acordo com as seguintes condições:
- atribuição – Tem de fazer a devida atribuição da autoria, fornecer uma hiperligação para a licença e indicar se foram feitas alterações. Pode fazê-lo de qualquer forma razoável, mas não de forma a sugerir que o licenciador o apoia ou subscreve o seu uso da obra.
- partilha nos termos da mesma licença – Se remisturar, transformar ou ampliar o conteúdo, tem de distribuir as suas contribuições com a mesma licença ou uma licença compatível com a original.
Legendas
Elementos retratados neste ficheiro
retrata
Um valor sem um elemento no repositório Wikidata
6 março 2023
image/png
614f635ddde1f8ff2cef9e0deeb08f4cdd305bd1
86 758 byte
870 pixel
855 pixel
Histórico do ficheiro
Clique uma data e hora para ver o ficheiro tal como ele se encontrava nessa altura.
| Data e hora | Miniatura | Dimensões | Utilizador | Comentário | |
|---|---|---|---|---|---|
| atual | 07h18min de 6 de março de 2023 |  | 855 × 870 (85 kB) | Nsae Comp | Uploaded own work with UploadWizard |
Utilização local do ficheiro
A seguinte página usa este ficheiro:
Utilização global do ficheiro
As seguintes wikis usam este ficheiro:
- ar.wiki.x.io
- bs.wiki.x.io
- de.wiki.x.io
- el.wiki.x.io
- en.wiki.x.io
Metadados
Este ficheiro contém informação adicional, provavelmente adicionada a partir da câmara digital ou scanner utilizada para criar ou digitalizar a imagem. Caso o ficheiro tenha sido modificado a partir do seu estado original, alguns detalhes poderão não refletir completamente as mudanças efetuadas.
| Resolução horizontal | 37,79 pt/cm |
|---|---|
| Resolução vertical | 37,79 pt/cm |


